3D Isometric City: Visualizing Urban Planning and Transport Logistics
Visualizing complex systems like urban infrastructure and transport logistics can be challenging, especially when trying to communicate ideas clearly to different audiences. That’s where 3D Isometric City illustrations come in handy. These visual tools offer a simplified yet detailed way to represent cities, industrial layouts, and transportation networks in a way that’s easy to understand and visually engaging.
What Is a 3D Isometric City?
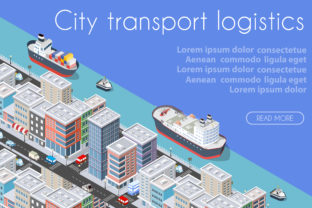
A 3D Isometric City is a type of illustrated template that uses isometric projection—a method of visually representing 3D objects in 2D space—to show cityscapes, industrial zones, and transport systems. Unlike traditional flat illustrations, isometric designs give depth and dimension without the complexity of full 3D modeling. This makes them ideal for infographics, presentations, and educational materials where clarity and visual appeal matter.
Purpose and Key Characteristics
The main goal of a 3D Isometric City illustration is to simplify complex urban and transport systems into digestible visuals. These templates often include elements like roads, railways, ports, industrial buildings, vehicles, and even people. They are designed to be modular, meaning you can mix and match components to create a custom layout tailored to your specific needs.
Some of the standout features of these illustrations include:
- Visual clarity – The isometric perspective allows viewers to see multiple sides of a structure at once.
- Scalability – Easily expandable to show small towns or sprawling metropolitan areas.
- Customizability – Many templates are available in editable formats like SVG or vector-based files, allowing for color changes and layout adjustments.
- Professional appeal – Used widely in business reports, proposals, and digital marketing materials.
Why Use a 3D Isometric City?
If you're involved in urban planning, logistics, architecture, or education, 3D Isometric City visuals can help you communicate your ideas more effectively. Whether you're explaining a new transport route to stakeholders or teaching students about industrial infrastructure, these illustrations make complex ideas easier to grasp.
For example, imagine trying to explain how a new subway line will integrate with existing roads and bus routes using only text or a flat map. Now picture the same explanation using a layered isometric view that clearly shows how each part connects and functions together. The difference in clarity and impact is significant.
Who Benefits from 3D Isometric City Visuals?
These visuals are useful for a wide range of people and professions:
- Urban planners – To design and present city layouts.
- Transport engineers – To visualize logistics hubs and distribution networks.
- Educators – To teach geography, infrastructure, and urban development concepts.
- Marketers – To create engaging content for infrastructure-related campaigns.
- Business owners – To explain supply chain operations to clients or investors.
Where and How Can You Use These Templates?
3D Isometric City illustrations are versatile and can be used in many contexts:
- Presentation slides – Whether you're pitching a new logistics solution or teaching a class, these visuals make your slides more engaging.
- Reports and whitepapers – Add clarity to technical documents with well-designed visuals.
- Website infographics – Improve user experience by breaking down complex systems into visual stories.
- Social media content – Share simplified visuals that highlight key features of your city or transport project.
- Training materials – Help new employees understand industrial layouts or supply chain operations.
Real-World Examples and Use Cases
Let’s say you run a logistics company and need to explain how your new warehouse will integrate with existing delivery routes. A 3D Isometric City template can help you show the location of the warehouse, the flow of goods, and how it connects with roads and transport hubs—all in one clear image.
Or imagine you're a teacher explaining how a city’s public transportation system works. Instead of using a flat diagram, you can use an isometric view to show how buses, trains, and subways interact across different levels of the city.
Another example is for digital marketers creating content about smart cities or sustainable infrastructure. These visuals can be used in blog posts, landing pages, or explainer videos to support complex ideas with engaging visuals.
Things to Consider Before Using 3D Isometric City Illustrations
While these templates are powerful tools, there are a few things to keep in mind before diving in:
- Compatibility – Make sure the format of the illustration works with your software (e.g., PowerPoint, Adobe Illustrator, Figma).
- Customization options – Look for templates that allow color changes, layout edits, and element additions.
- Relevance – Choose a template that aligns with your topic. For example, if you're focusing on industrial infrastructure, look for templates that include factories, warehouses, and transport logistics elements.
- Licensing – Check usage rights, especially if you plan to use the visuals in commercial content or printed materials.
Learning and Applying 3D Isometric Design
If you're new to 3D Isometric City design, don’t worry—it’s easier to learn than it looks. Many online platforms offer beginner-friendly tutorials on creating and editing isometric visuals. Tools like Adobe Illustrator, Blender, and free online editors like Vectr or Inkscape can help you get started.
Start by exploring existing templates, then experiment with modifying colors, adding labels, or combining elements to create your own visuals. As you become more comfortable, you can design custom layouts from scratch or integrate isometric elements into larger design projects.
Final Thoughts
Whether you're explaining transport logistics, designing a city layout, or creating engaging educational content, 3D Isometric City illustrations offer a powerful way to communicate complex ideas clearly and visually. They combine functionality with aesthetic appeal, making them a valuable tool for professionals, educators, and creators across industries.
By understanding how to use and customize these visuals, you can enhance your presentations, reports, and marketing materials—making your ideas not only understood but remembered.